eBPF and BCC
Table of Contents
1. eBPF简介
BPF (Berkeley Packet Filter),最初构想提出于 1992 年,其目的是为了提供一种过滤包的方法,并且要避免从内核空间到用户空间的数据包复制行为。它最初是由从用户空间注入到内核的一个简单的字节码构成,它在那个位置利用一个校验器进行检查(以避免内核崩溃或者安全问题),并附着到一个套接字上,接着在每个接收到的包上运行字节码。几年后它被移植到 Linux 上,并且应用于一小部分应用程序上(例如,tcpdump 就使用了 BPF)。其简化的语言以及存在于内核中的即时编译器(JIT),使 BPF 成为一个性能卓越的工具。
在 2013 年,Alexei Starovoitov 对 BPF 进行彻底地改造,并增加了新的功能,改善了性能。这个新版本被命名为 eBPF (意思是 “extended BPF”)。新版本出现了如映射和尾调用这样的新特性,并且 JIT 编译器也被重写了。
为了兼容,传统的 BPF 仍被保留了下来,并被重命名为 classical BPF(cBPF)。 相对于 cBPF,新的 eBPF 的应该范围要广得多,它为内核追踪(Kernel Tracing)、应用性能调优/监控、流控(Traffic Control)等领域带来了激动人心的变革。
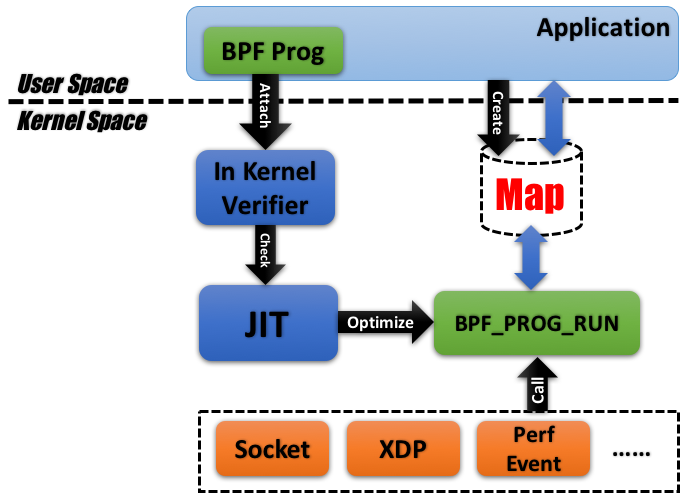
Figure 1: Architecture of eBPF
eBPF 这个名称多少有点词不达意,Brendan Gregg 认为 VKIS (Virtual Kernel Instruction Set) 可能更恰当。Brendan Gregg 对 eBPF 有下面的类比说明:
eBPF does to Linux what JavaScript does to HTML. (Sort of.) So instead of a static HTML website, JavaScript lets you define mini programs that run on events like mouse clicks, which are run in a safe virtual machine in the browser. And with eBPF, instead of a fixed kernel, you can now write mini programs that run on events like disk I/O, which are run in a safe virtual machine in the kernel. In reality, eBPF is more like the v8 virtual machine that runs JavaScript, rather than JavaScript itself. eBPF is part of the Linux kernel.
Programming in eBPF directly is incredibly hard, the same as coding in v8 bytecode. But no one codes in v8: they code in JavaScript, or often a framework on top of JavaScript (jQuery, Angular, React, etc). It's the same with eBPF. People will use it and code in it via frameworks. For tracing, the main ones are bcc and bpftrace.
摘自:http://www.brendangregg.com/blog/2019-01-01/learn-ebpf-tracing.html
1.1. Front-ends for eBPF
直接编写 eBPF 字节码显然不太现实,我们需要一些工具来生成 eBPF 字节码,如表 1 所示,其中工具 bcc 和 bpftrace 值得推荐。
| Front end | Difficulty | Pros | Cons | References |
|---|---|---|---|---|
| BPF bytecode | Brutal | Precise control | Insanely difficult | Kernel source: struct bpf_insn prog in samples/bpf/sock_example.c |
| C | Hard | Build stand-alone binaries | Difficult | Kernel source: samples/bpf/tracex1_kern.c and samples/bpf/tracex1_user.c |
| perf | Hard | Use perf's capabilities: custom events, stack walking | Difficult, not yet well documented | See: http://www.brendangregg.com/ebpf.html#perf |
| bcc | Moderate | Custom output, Python libraries, large community, production use (eg Facebook, Netflix) | Verbose | See: http://www.brendangregg.com/ebpf.html#bcc |
| bpftrace | Easy | Powerful one-liners, many capabilities, growing community, production use (eg, Netflix) | Limited control of code and output | See: http://www.brendangregg.com/ebpf.html#bpftrace |
| ply | Easy | Powerful one-liners, small binary, for embedded | Limited control of code and output | Github: github.com/iovisor/ply. |
2. BCC (BPF Compiler Collection)
bcc 提供了一系列基于 eBPF 的工具(如图 2 所示),以方便使用。其在各个系统中的安装方法参见:https://github.com/iovisor/bcc/blob/master/INSTALL.md
Figure 2: Linux bcc/BPF tracing tools
bcc 提供的这些工具,可以参见:https://github.com/iovisor/bcc/tree/master/tools, 这个仓库中,每个工具都有一个对应的 example.txt 文件,可以帮助我们快速了解工具的使用。
下面是这些工具的一个列表(Ubuntu系统中为其增加了-bpfcc后缀,它们绝大部分都是python脚本):
/usr/sbin/bashreadline-bpfcc         /usr/sbin/javaflow-bpfcc        /usr/sbin/rubyobjnew-bpfcc
/usr/sbin/biolatency-bpfcc           /usr/sbin/javagc-bpfcc          /usr/sbin/rubystat-bpfcc
/usr/sbin/biosnoop-bpfcc             /usr/sbin/javaobjnew-bpfcc      /usr/sbin/runqlat-bpfcc
/usr/sbin/biotop-bpfcc               /usr/sbin/javastat-bpfcc        /usr/sbin/runqlen-bpfcc
/usr/sbin/bitesize-bpfcc             /usr/sbin/javathreads-bpfcc     /usr/sbin/slabratetop-bpfcc
/usr/sbin/bpflist-bpfcc              /usr/sbin/killsnoop-bpfcc       /usr/sbin/softirqs-bpfcc
/usr/sbin/btrfsdist-bpfcc            /usr/sbin/llcstat-bpfcc         /usr/sbin/solisten-bpfcc
/usr/sbin/btrfsslower-bpfcc          /usr/sbin/mdflush-bpfcc         /usr/sbin/sslsniff-bpfcc
/usr/sbin/cachestat-bpfcc            /usr/sbin/memleak-bpfcc         /usr/sbin/stackcount-bpfcc
/usr/sbin/cachetop-bpfcc             /usr/sbin/mountsnoop-bpfcc      /usr/sbin/statsnoop-bpfcc
/usr/sbin/capable-bpfcc              /usr/sbin/mysqld_qslower-bpfcc  /usr/sbin/syncsnoop-bpfcc
/usr/sbin/cobjnew-bpfcc              /usr/sbin/nfsdist-bpfcc         /usr/sbin/syscount-bpfcc
/usr/sbin/cpudist-bpfcc              /usr/sbin/nfsslower-bpfcc       /usr/sbin/tcpaccept-bpfcc
/usr/sbin/cpuunclaimed-bpfcc         /usr/sbin/nodegc-bpfcc          /usr/sbin/tcpconnect-bpfcc
/usr/sbin/dbslower-bpfcc             /usr/sbin/nodestat-bpfcc        /usr/sbin/tcpconnlat-bpfcc
/usr/sbin/dbstat-bpfcc               /usr/sbin/offcputime-bpfcc      /usr/sbin/tcplife-bpfcc
/usr/sbin/dcsnoop-bpfcc              /usr/sbin/offwaketime-bpfcc     /usr/sbin/tcpretrans-bpfcc
/usr/sbin/dcstat-bpfcc               /usr/sbin/oomkill-bpfcc         /usr/sbin/tcptop-bpfcc
/usr/sbin/deadlock_detector-bpfcc    /usr/sbin/opensnoop-bpfcc       /usr/sbin/tcptracer-bpfcc
/usr/sbin/deadlock_detector.c-bpfcc  /usr/sbin/phpcalls-bpfcc        /usr/sbin/tplist-bpfcc
/usr/sbin/execsnoop-bpfcc            /usr/sbin/phpflow-bpfcc         /usr/sbin/trace-bpfcc
/usr/sbin/ext4dist-bpfcc             /usr/sbin/phpstat-bpfcc         /usr/sbin/ttysnoop-bpfcc
/usr/sbin/ext4slower-bpfcc           /usr/sbin/pidpersec-bpfcc       /usr/sbin/vfscount-bpfcc
/usr/sbin/filelife-bpfcc             /usr/sbin/profile-bpfcc         /usr/sbin/vfsstat-bpfcc
/usr/sbin/fileslower-bpfcc           /usr/sbin/pythoncalls-bpfcc     /usr/sbin/wakeuptime-bpfcc
/usr/sbin/filetop-bpfcc              /usr/sbin/pythonflow-bpfcc      /usr/sbin/xfsdist-bpfcc
/usr/sbin/funccount-bpfcc            /usr/sbin/pythongc-bpfcc        /usr/sbin/xfsslower-bpfcc
/usr/sbin/funclatency-bpfcc          /usr/sbin/pythonstat-bpfcc      /usr/sbin/zfsdist-bpfcc
/usr/sbin/funcslower-bpfcc           /usr/sbin/reset-trace-bpfcc     /usr/sbin/zfsslower-bpfcc
/usr/sbin/gethostlatency-bpfcc       /usr/sbin/rubycalls-bpfcc
/usr/sbin/hardirqs-bpfcc             /usr/sbin/rubyflow-bpfcc
2.1. execsnoop(监控新进程的创建)
execsnoop 可以监控通过系统调用 exec 创建的进程(当然是启动工具后再创建的新进程),并且把它们的启动参数打印出来。如:
$ sudo execsnoop
PCOMM            PID    PPID   RET ARGS
ls               6220   6193     0 /bin/ls --color=auto -l
sshd             6222   1151     0 /usr/sbin/sshd -D -R
ping             6226   6193     0 /bin/ping www.bing.com
curl             6230   6193     0 /usr/bin/curl www.baidu.com
2.2. tcpconnect(监控主动的tcp连接)
tcpconnect 可以监控主动的tcp连接,即监控系统调用 connect() 。如:
$ sudo tcpconnect
PID    COMM         IP SADDR            DADDR            DPORT
25333  recordProgra 4  127.0.0.1        127.0.0.1        28527
25338  curl         4  100.66.3.172     52.22.109.254    80
25340  curl         4  100.66.3.172     31.13.73.36      80
25342  curl         4  100.66.3.172     104.20.25.153    80
25344  curl         4  100.66.3.172     50.56.53.173     80
25365  recordProgra 4  127.0.0.1        127.0.0.1        28527
26119  ssh          6  ::1              ::1              22
25388  recordProgra 4  127.0.0.1        127.0.0.1        28527
25220  ssh          6  fe80::8a3:9dff:fed5:6b19 fe80::8a3:9dff:fed5:6b19 22
[...]
2.3. tcpaccept(监控被动的tcp连接)
tcpaccept 可以监控被动的tcp连接,即监控系统调用 accept() 。如:
# tcpaccept
PID    COMM         IP RADDR            LADDR            LPORT
2287   sshd         4  11.16.213.254    100.66.3.172     22
4057   redis-server 4  127.0.0.1        127.0.0.1        28527
4057   redis-server 4  127.0.0.1        127.0.0.1        28527
4057   redis-server 4  127.0.0.1        127.0.0.1        28527
4057   redis-server 4  127.0.0.1        127.0.0.1        28527
2287   sshd         6  ::1              ::1              22
4057   redis-server 4  127.0.0.1        127.0.0.1        28527
4057   redis-server 4  127.0.0.1        127.0.0.1        28527
2287   sshd         6  fe80::8a3:9dff:fed5:6b19 fe80::8a3:9dff:fed5:6b19 22
4057   redis-server 4  127.0.0.1        127.0.0.1        28527
[...]
2.4. oomkill(监控系统的OOM)
oomkill 可以监控系统的OOM killer(Out Of Memory killer),参考:https://github.com/iovisor/bcc/blob/master/tools/oomkill_example.txt
2.5. gethostlatency(监控DNS解析时间)
gethostlatency 可以监控系统调用 getaddrinfo(), gethostbyname(), and gethostbyname2() ,从而统计出DNS解析时间。如:
$ sudo gethostlatency
TIME      PID    COMM          LATms HOST
06:10:24  28011  wget          90.00 www.iovisor.org
06:10:28  28127  wget           0.00 www.iovisor.org
06:10:41  28404  wget           9.00 www.netflix.com
06:10:48  28544  curl          35.00 www.netflix.com.au
06:11:10  29054  curl          31.00 www.plumgrid.com
06:11:16  29195  curl           3.00 www.facebook.com
06:11:25  29404  curl          72.00 foo
06:11:28  29475  curl           1.00 foo
2.6. mysqld_qslower(监控Mysql慢查询)
MySQL本身就支持记录慢查询log。bcc的工具 mysqld_qslower 提供了另外一种监控MySQL慢查询的思路,参考:http://www.brendangregg.com/blog/2016-10-04/linux-bcc-mysqld-qslower.html
2.7. funccount(统计函数调用次数)
funccount 可以统计函数调用次数,参考:https://github.com/iovisor/bcc/blob/master/tools/funccount_example.txt
想要统计的函数通过 pattern 来指定,pattern 的规则如下:
func            -- probe a kernel function
lib:func        -- probe a user-space function in the library 'lib'
/path:func      -- probe a user-space function in binary '/path'
p::func         -- same thing as 'func'
p:lib:func      -- same thing as 'lib:func'
t:cat:event     -- probe a kernel tracepoint
u:lib:probe     -- probe a USDT tracepoint
2.8. funcslower(监控执行时间大于阈值的函数)
funcslower 可以监控执行时间大于阈值的函数,参考:https://github.com/iovisor/bcc/blob/master/tools/funcslower_example.txt
2.9. trace(监控函数调用,输出其参数和返回值)
trace 可以监控函数调用,并输出其参数和返回值,参考:https://github.com/iovisor/bcc/blob/master/tools/trace_example.txt
2.10. Tips
2.10.1. 跟踪Golang函数
为避免代码中的函数由于内联优化而消失,在运行 go build 时需要指定 -gcflags="-l" 。
golang编译时并没有严格遵守AMD64 ABI,这导致使用 bcc 工具打印函数参数时可能得到错误的值。因为AMD64 ABI要求函数的前几个参数分别在寄存器rdi/rsi/rdx/r10/r8/r9中:
       arch/ABI      arg1  arg2  arg3  arg4  arg5  arg6  arg7  Notes
       ──────────────────────────────────────────────────────────────────
[...]
       x86_64        rdi   rsi   rdx   r10   r8    r9    -
但是,golang却是通过栈来传递参数。
关于使用bcc工具调试跟踪Golang程序的更多技巧可参考:http://www.brendangregg.com/blog/2017-01-31/golang-bcc-bpf-function-tracing.html
这里有一个临时的解决办法:https://github.com/iovisor/bcc/issues/934
3. 参考
eBPF 简史:https://www.ibm.com/developerworks/cn/linux/l-lo-eBPF-history/index.html
Learn eBPF Tracing: Tutorial and Examples: http://www.brendangregg.com/blog/2019-01-01/learn-ebpf-tracing.html
Linux Extended BPF (eBPF) Tracing Tools: http://www.brendangregg.com/ebpf.html