Sensor Model (Measurement Model)
Table of Contents
1. Sensor Model 简介
回顾一下,用于状态估计的贝叶斯滤波公式如下:
\[bel(x_t) = \eta \, \underbrace{p(z_t \mid x_t)}_{\text{Sensor Model}} \int \underbrace{p(x_t \mid x_{t-1}, u_t)}_{\text{Motion Model}} bel(x_{t-1}) \, \mathrm{d} x_{t-1}\]
其中,系统的控制量模型(Motion Model)和传感器模型(Measurement Model, or Sensor Model)需要提前建立好。
这里我们要讨论的模型是 Sensor Model,当我们用于机器人定位导航中时,可记为 \(p(z_t \mid x_t, m)\) ,其中, \(x_t\) 是机器人位姿, \(m\) 是环境地图, \(z_t\) 是测量值。
多个传感器会得到多个测量值,这时 \(z_t\) 可以这样表示:
\[z_t = \{ z_t^1, z_t^2, \cdots, z_t^K\}\]
一般地,假设测量值之间是相互独立的,这时有:
\[p(z_t \mid x_t, m) = \prod_{k=1}^K p(z_t^k \mid x_t, m)\]
本文主要摘自:Probabilistic Robotics, by Sebastian Thrun, 6 Robot Perception
2. Sensor
We classify sensors using two important functional axes: proprioceptive/exteroceptive and passive/active.
Proprioceptive sensors measure values internal to the system (robot); for example, motor speed, wheel load, robot arm joint angles, battery voltage.
Exteroceptive sensors acquire information from the robot’s environment; for example, distance measurements, light intensity, sound amplitude.
Passive sensors measure ambient environmental energy entering the sensor. Examples of passive sensors include temperature probes, microphones, and CCD or CMOS cameras.
Active sensors emit energy into the environment, then measure the environmental reaction.
图 1 列出了一些常用的传感器。
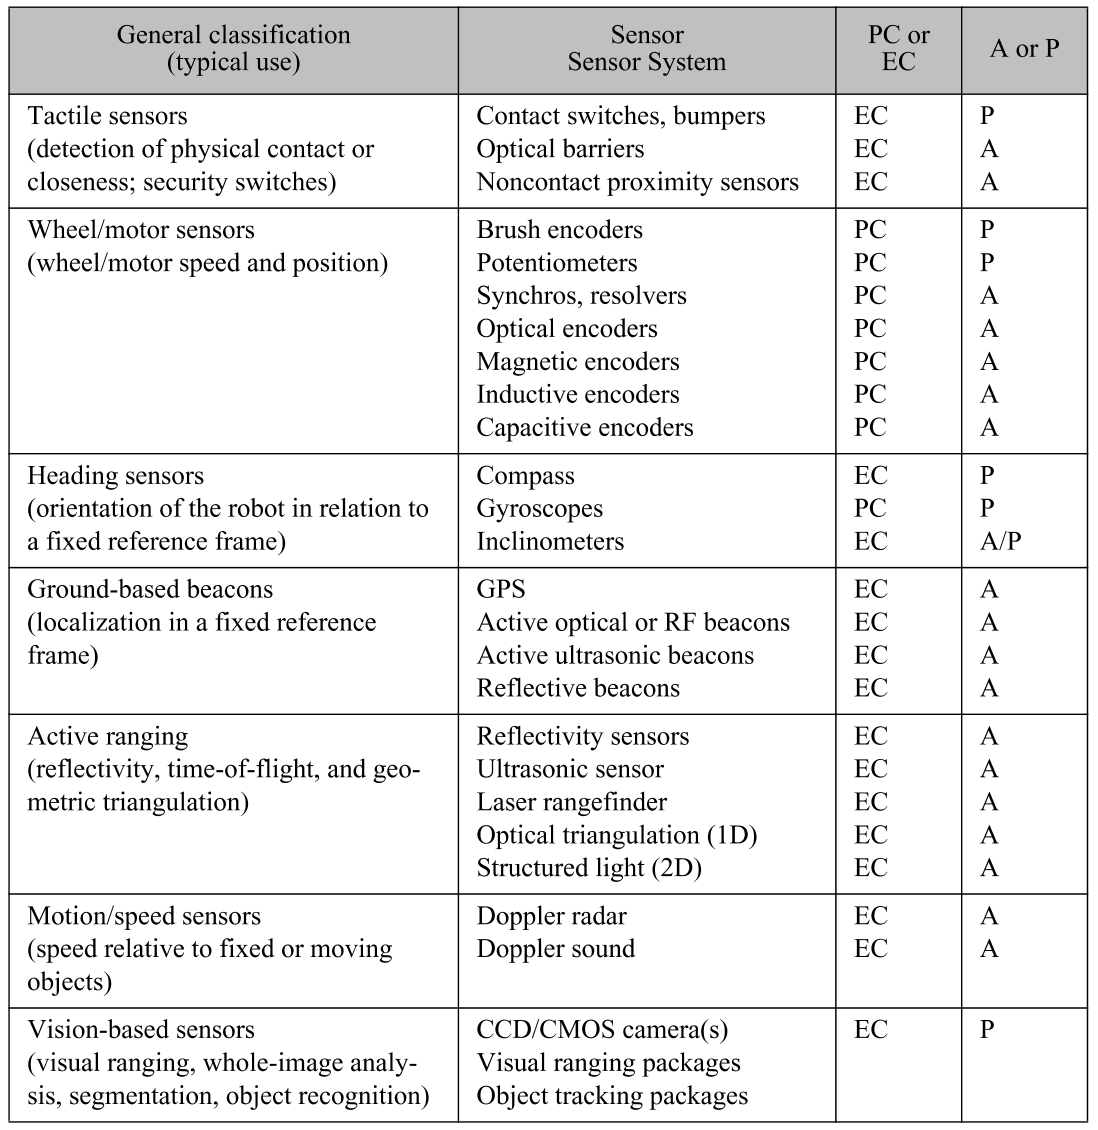
Figure 1: Sensors for Mobile Robots (PC, proprioceptive; EC, exteroceptive; A, active; P, passive; P/A, passive/active)
例如 BIBA Robot 装备了如图 2 所示的传感器。
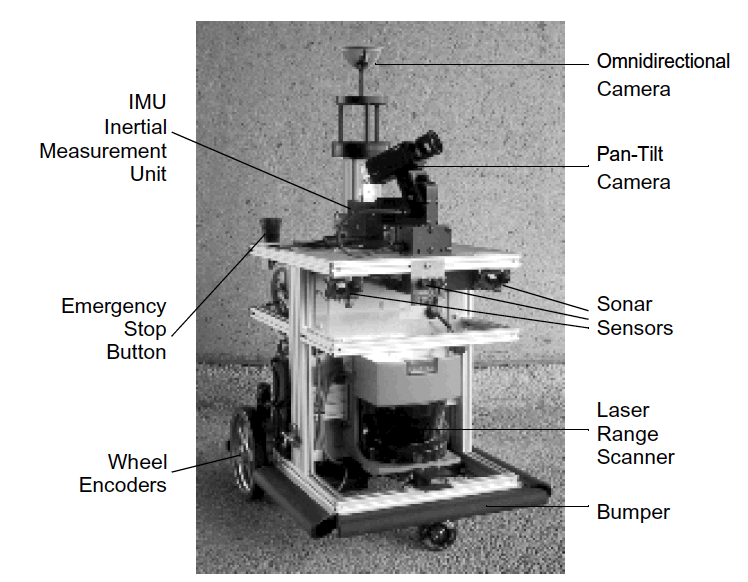
Figure 2: BIBA Robot, BlueBotics SA
参考:Introduction to Autonomous Mobile Robots, by Roland Siegwart, Illah Reza Nourbakhsh, 4.2 Sensors for Mobile Robots
2.1. Range Finders
测距仪(Range finders)可以用来测量仪器到物体的距离,它是机器人中最广泛使用的传感器。超声波传感器(Ultrasonic Sensors)和激光测距仪(Laser Range Finders)是两种常用的测距仪。
根据原理的不同,距离测量一般有下面三种方法:
- Sensors based on measuring the time-of-flight (TOF) of a pulse of emitted energy traveling to a reflecting object, then echoing back to a receiver.
- The phase-shift measurement (or phase-detection) ranging technique involves continuous wave transmission as opposed to the short pulsed outputs used in TOF systems.
- Sensors based on frequency-modulated (FM) radar. This technique is somewhat related to the (amplitude-modulated) phase-shift measurement technique.
参考:Navigating Mobile Robots - Sensors and Techniques, by J. Borenstein, Chapter 4 Sensors for Map-Based Positioning
3. Sensor Model
3.1. Beam Models of Range Finders
Beam Model 对下面四类错误进行了建模:
(1) small measurement noise,
(2) errors due to unexpected objects,
(3) errors due to failures to detect objects,
(4) random unexplained noise.
对包含每一类错误的测量模型都建立一个概率分布模型,设相应的四个概率分布分别为: \(p_{\text{hit}}(z_t^k \mid x_t, m),\; p_{\text{short}}(z_t^k \mid x_t, m),\; p_{\text{max}}(z_t^k \mid x_t, m),\; p_{\text{rand}}(z_t^k \mid x_t, m)\) ,最终的测量模型 \(p(z_t^k \mid x_t, m)\) 可由这四个概率分布混合而来:
\[p(z_t^k \mid x_t, m) = \begin{pmatrix} z_{\text{hit}} \\ z_{\text{short}} \\ z_{\text{max}} \\ z_{\text{rand}} \end{pmatrix}^{\mathsf{T}} \cdot \begin{pmatrix} p_{\text{hit}}(z_t^k \mid x_t, m) \\ p_{\text{short}}(z_t^k \mid x_t, m) \\ p_{\text{max}}(z_t^k \mid x_t, m) \\ p_{\text{rand}}(z_t^k \mid x_t, m) \end{pmatrix}\]
其中, \(z_{\text{hit}},\; z_{\text{short}},\; z_{\text{max}},\; z_{\text{rand}}\) 为权重参数,满足 \(z_{\text{hit}} + z_{\text{short}} + z_{\text{max}} + z_{\text{rand}} = 1\) 。
下面将分别介绍 Beam Model 中四类错误对应的测量概率分布。
3.1.1. Beam Model 中四类错误相关的概率模型
设 \(z_t^k\) 是测量值, \(z_t^{k*}\) 是测距仪到物体的“真实”距离,“真实”距离可以从地图中求出,方法如下: In location-based maps, the range \(z_t^{k*t}\) can be determined using ray casting; in feature-based maps, it is usually obtained by searching for the closest feature within a measurement cone.
Beam Model 中四类错误对应的测量概率分布如图 3 所示。
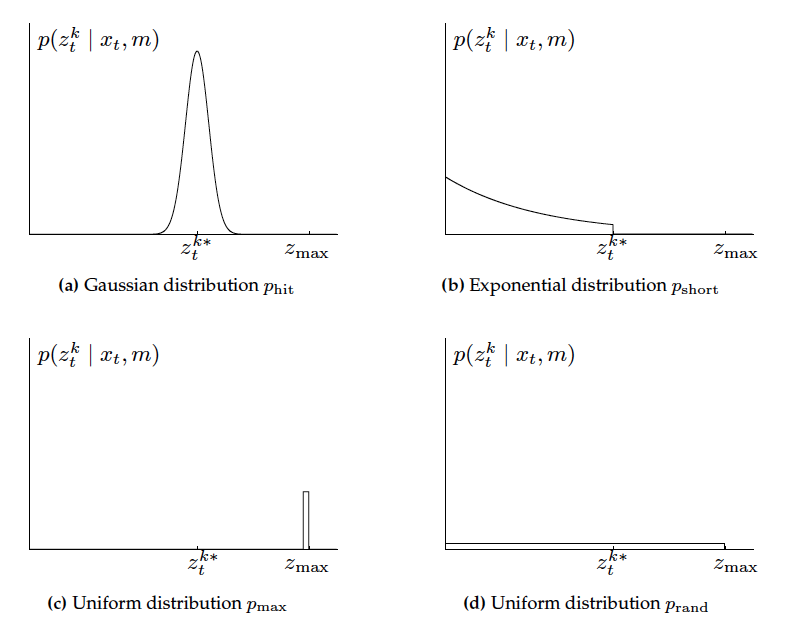
Figure 3: Components of the range finder sensor model.
下面,我们将一一分析这些概率分布的由来。
3.1.1.1. 第一类错误(Small Measurement Noise)
第一类错误是“仪器的测量噪声”引起的错误。假设仅包含第一类错误的测量概率服从均值为 \(z_t^{k*}\) ,标准差为 \(\sigma_{\text{hit}}\) 的正态分布。一般在应用时限制其范围为 \([0; z_{\text{max}}]\) , \(z_{\text{max}}\) 为测距仪最大的可测距离。
记仅包含第一类错误的测量概率的分布为 \(p_{\text{hit}}(z_t^k \mid x_t, m)\) ,从而有:
\[p_{\text{hit}}(z_t^k \mid x_t, m) = \begin{cases} \eta \frac{1}{\sqrt{2\pi \sigma_{\text{hit}}^2}} e^{- \frac{(z_t^{k} - z_t^{k*})^2}{2\sigma_{\text{hit}}^2}} & \text{if} \; 1 \le z_t^k \le z_{\text{max}} \\
0 & \text{otherwise} \\
\end{cases}\]
其中, \(\eta\) 为归一化常数,其计算方法如下:
\[\eta = \left( \int_0^{z_{\text{max}}} \frac{1}{\sqrt{2\pi \sigma_{\text{hit}}^2}} e^{- \frac{(z_t^{k} - z_t^{k*})^2}{2\sigma_{\text{hit}}^2}} \, \mathrm{d} z_t^{k} \right)^{-1}\]
\(p_{\text{hit}}(z_t^k \mid x_t, m)\) 的示意图如图 3 中图(a)所示。
3.1.1.2. 第二类错误(Unexpected Objects)
第二类错误是“Unexpected objects”引起的错误。一般地,环境是动态的(物体可能移动),而地图是静止的。这样,那些地图中没有相关信息的物体(Unexpected objects)可能会挡住被测距的物体,这时测距仪会返回一个比期待值要小的距离数据,这就是第二类错误。
说明:也可以把“Unexpected objects”可以当作状态空间的一部分,对其进行位置估计;但是把它当作噪声要简单得多。
One way to deal with such objects is to treat them as part of the state vector and estimate their location; another, much simpler approach, is to treat them as sensor noise.
如何对仅包含第二类错误的测量模型进行建模呢?考虑这样一个场景,有多个“Unexpected objects”可能出现在测距仪和被测距物体之间,测量 100 次,这 100 个测量数据会满足些什么性质呢?我们会发现,100 个测量数据中数值比较小(和“真实”距离偏差大)的数据应该比数值大(更接近“真实”距离)的数据多,这是因为当有多个“Unexpected objects”同时出现在测距仪和被测距物体之间时,得到的测量数据仅和离测距仪较近的“Unexpected objects”相关,这表明测距仪更倾向于得到一个数值小的数据。所以,这些测量数据中数值小的数据(和“真实”距离偏差大)会多于数值大(更接近“真实”距离)的数据。
上面分析的这些数据特点可以用“指数分布”(记指数分布参数为 \(\lambda_{\text{short}}\) )来表达。双由于测距仪返回的数据都会小于“真实”距离 \(z_t^{k*}\) ,所以我们限制其范围为 \([0; z_t^{k*}]\) 。记仅包含第二类错误的测量概率的分布为 \(p_{\text{short}}(z_t^k \mid x_t, m)\) ,从而有:
\[p_{\text{short}}(z_t^k \mid x_t, m) = \begin{cases} \eta \lambda_{\text{short}} e^{-\lambda_{\text{short}} z_t^k} & \text{if} \; 1 \le z_t^k \le z_t^{k*} \\
0 & \text{otherwise} \\
\end{cases}\]
其中, \(\eta\) 为归一化常数,其计算方法如下:
\[\eta = \left( \int_0^{z_t^{k*}} \lambda_{\text{short}} e^{-\lambda_{\text{short}} z_t^k} \, \mathrm{d} z_t^{k} \right)^{-1} = \frac{1}{1 - e^{-\lambda_{\text{short}} z_t^{k*}}}\]
\(p_{\text{short}}(z_t^k \mid x_t, m)\) 的示意图如图 3 中图(b)所示。
3.1.1.3. 第三类错误(Failures to Detect Objects)
第三类错误是物体在测量范围内却“没有发现物体”引起的错误。这种情况是常常发生的,如用超声波传感器测量一个表面平而光滑的物体,且物体表面和超声波不垂直时(这时会发生镜面反射),超声波传感器很可能无法发现物体。对于激光测距仪,这种错误也可能发生,如测量一个表面能吸收光的物体(Light-absorbing Objects)时,激光测距仪也可能无法发现物体。对于这些情况,测距仪会返回它的最大测量距离 \(z_{\text{max}}\) 。
记仅包含第三类错误的测量概率的分布为 \(p_{\text{max}}(z_t^k \mid x_t, m)\) ,有:
\[p_{\text{max}}(z_t^k \mid x_t, m) = \begin{cases} 1 & \text{if} \; z_t^k = z_{\text{max}} \\
0 & \text{otherwise} \\
\end{cases}\]
\(p_{\text{max}}(z_t^k \mid x_t, m)\) 的示意图如图 3 中图(c)所示。
3.1.1.4. 第四类错误(Random Unexplained Noise)
第四类是错误是测量仪有时返回的那些不明原因的错误测量值(Unexplainable Measurements)。对于超声波传感器,这类错误包含多个传感器的串音干扰(Cross-talk)等等错误。
记仅包含第四类错误的测量概率的分布为 \(p_{\text{rand}}(z_t^k \mid x_t, m)\) ,有:
\[p_{\text{rand}}(z_t^k \mid x_t, m) = \begin{cases} \frac{1}{z_{\text{max}}} & \text{if} \; 0 \le z_t^k \le z_{\text{max}} \\
0 & \text{otherwise} \\
\end{cases}\]
\(p_{\text{rand}}(z_t^k \mid x_t, m)\) 的示意图如图 3 中图(d)所示。
3.1.2. Beam Model 算法总结
前面介绍过,多个传感器会得到多个测量值, \(z_t\) 可这样表达 \(z_t = \{ z_t^1, z_t^2, \cdots, z_t^K\}\) ,假设测量值之间是相互独立的,这时有: \(p(z_t \mid x_t, m) = \prod_{k=1}^K p(z_t^k \mid x_t, m)\) 。
用 Beam Model 算法来计算 \(p(z_t \mid x_t, m)\) 的过程可表述为图 4 所示。
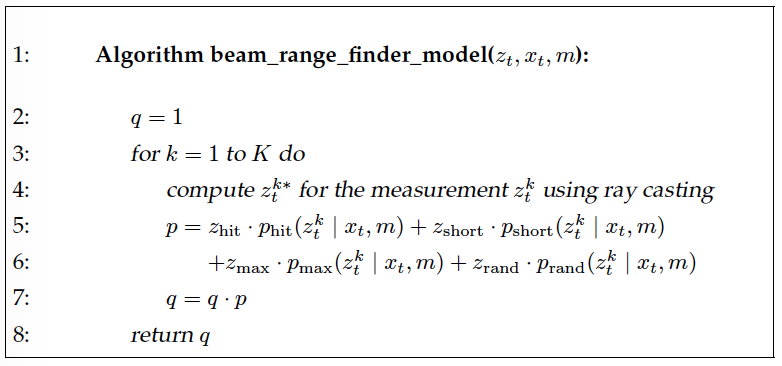
Figure 4: Algorithm for computing the likelihood of a range scan \(z_t\)
3.1.3. 计算 Beam Model 的参数(EM 算法)
前面已经介绍过 Beam Model,但模型中的 6 个参数(包括权重参数 \(z_{\text{hit}},\; z_{\text{short}},\; z_{\text{max}},\; z_{\text{rand}}\) 、正态分布参数 \(\sigma_{\text{hit}}\) 、指数分布参数 \(\lambda_{\text{short}}\) )如何确定呢?
可以使用 Expectation Maximization (EM) Algorithm 从真实测试数据中学习得到 Beam Model 的参数,具体过程略。可以参考:Probabilistic Robotics, by Sebastian Thrun, 6.3.2 Adjusting the Intrinsic Model Parameters
3.1.4. Beam Model 的缺点
Beam Model 和测距仪的几何结构和物理性质紧密相关,它有下面的缺点:
(1) not smooth for small obstacles and at edges.
(2) not very efficient.
参考:
http://ais.informatik.uni-freiburg.de/teaching/ss15/robotics/slides/07-sensor-models.pdf
Probabilistic Robotics, by Sebastian Thrun, 6.3.5 Limitations of the Beam Model
3.2. Likelihood Field Models for Range Finders
Beam Model 测距仪的几何结构和物理性质紧密相关,这导致用它计算的概率不是平稳的(not smooth),机器人位姿的细微变化可能导致计算的结果的差异非常大,Likelihood Field Models 可以克服 Beam Model 的这个缺点。
这里不详细介绍 Likelihood Field Models,可参考 Probabilistic Robotics, by Sebastian Thrun, 6.4 Likelihood Fields for Range Finders
3.3. Feature Based Sensor Models
除了直接从原始 Sensor 数据中建立 Sensor Model 外,还可以先从高维的 Sensor 数据中得到 feature,再基于 feature 建立 Sensor Model。这样做的好处是极大地减少了计算的复杂性:
A key advantage of this approach is the enormous reduction of computational complexity: While inference in the high-dimensional measurement space can be costly, inference in the low-dimensional feature space can be orders of magnitude more efficient.
参考:Probabilistic Robotics, by Sebastian Thrun, 6.6 Feature-Based Measurement Models
In many robotics applications, features correspond to distinct objects in the physical world. In robotics, it is common to call those physical objects landmarks, to indicate that they are being used for robot navigation.
The most common model for processing landmarks assumes that the sensor can measure the range and the bearing of the landmark relative to the robot’s local coordinate frame.
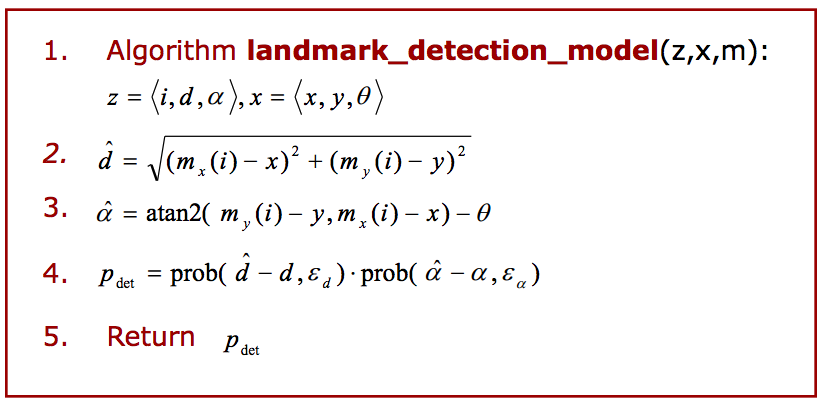
Figure 5: Landmark Sensor Model(其中 \(i\) 是 landmark 的标记, \(d\) 是 landmark 的距离, \(\alpha\) 是 landmark 的方向)
摘自:http://ais.informatik.uni-freiburg.de/teaching/ss15/robotics/slides/07-sensor-models.pdf